


Abstract
In this study, soil bacterial communities and the temperature responses (Q10) of substrate-induced respiration were compared between an alpine dry meadow and a subalpine forest in the Colorado Rocky Mountains. Bacterial communities in three seasons from each environment were described with 16S rRNA gene clone libraries. The main goal of this comparison was to relate phylogenetic differences among bacterial communities with variation in soil respiratory temperature sensitivities along seasonal and altitudinal gradients. The warmer, lower elevation, subalpine forest soil exhibited large seasonal variations in Q10. Subalpine Q10 values were highest in summer, and were higher than alpine values in all seasons except winter. Q10 in alpine soils were consistently low throughout the year. Alpine and subalpine bacterial communities both varied seasonally, and were markedly distinct from each other. Based on Fst analysis, subalpine communities from colder times of year were more similar to the alpine communities than were subalpine summer communities. Principle component analysis of the pairwise genetic distances (Fst) between communities produced two factors that accounted for 69% and 22% of the total variance in the data set. These factors demonstrated a significant relationship between bacterial community structure and temperature response when regressed on log-transformed Q10 data.
Introduction
Despite the growing number of studies that describe environmental microbial diversity, knowledge of microbial biogeography is very scarce (Fierer & Jackson, 2006; Hughes-Martiny et al., 2006), as is the understanding of the ecological roles of uncultured microorganisms (Torsvik & Ovreas, 2002). For example, the temperature responses of uncultured organisms cannot be inferred with certainty based on the environment from which their rRNA genes were isolated and sequenced. Even assuming that the sequences found in a given environment represent indigenous organisms that are capable of tolerating ambient conditions, their temperature optima are not necessarily closely matched to the average temperature of that environment. Organisms found in surveys of uncultured diversity may only be active during certain seasons or times of the day. Furthermore, microorganisms with moderate temperature optima but low temperature minima are quite common in cold environments. Based on sequence information alone, these psychrotolerant microorganisms cannot be differentiated from obligate psychrophiles found in the same environment. Numerous descriptions of uncultured bacterial diversity exist for various cold environments (Franzmann, 1996; Zhou et al., 1997; Brambilla et al., 2001; Pearce et al., 2003; Lipson & Schmidt, 2004; Shivaji et al., 2004; Stackebrandt et al., 2004; Nemergut et al., 2005; Segawa et al., 2005), but it is hard to draw conclusions about the ecology of the indigenous microorganisms by studying an individual environment in isolation. Comparative studies that contrast communities across a range of environmental variables are needed to elucidate microbial distribution patterns. If such studies also include measurements of microbial activity, it may also shed light on the ecophysiological characteristics of uncultured microorganisms.
In this study, soil bacterial community composition, microbial respiratory temperature responses (Q10) and seasonal variations in these variables are compared between two locations at different elevations in the Colorado Rocky Mountains: an alpine dry meadow and a subalpine forest. Seasonal variations in the structure and function of the alpine soil microbial community have been described previously (Lipson et al., 1999, 2002; Schadt et al., 2003; Lipson & Schmidt, 2004). In the current study, previously published bacterial diversity (Lipson & Schmidt, 2004) and respiration data (Lipson et al., 1999) are reanalyzed in conjunction with previously unpublished data from a subalpine forest, c. 5 km from the alpine site. The overall goal was to relate differences in phylogeny and community structure to environmental and functional differences between the two ecosystems. Specifically, this approach could possibly indicate the temperature responses of certain groups of uncultured organisms. Comparing geographically close but environmentally distinct communities also provides an opportunity to examine the dominant forces that structure microbial communities. For example, do species frequently invade adjacent ecosystem types, given the high winds and close proximity between the two areas, or are the two sets of microorganisms highly specialized and restricted to their respective ranges? Finally, a comparison of temperature responses of microbial activity in two adjacent ecosystem types could be relevant for understanding the effects of altitudinal and latitudinal vegetation shifts in response to climate change.
Materials and methods
Site description and sample collection
This study was conducted at two sites on Niwot Ridge in the Front Range of the Colorado Rocky Mountains. The subalpine forest site is 500 m lower in elevation, has a warmer temperature regime, higher soil organic matter content and lower soil pH than the alpine site (Table 1). The subalpine forest located at 40° 1′ 58″ N, 105° 32′ 47″ W. The forest is dominated by Abies lasiocarpa (subalpine fir), Pinus contorta (lodgepole pine), and Picea engelmanii (Engelmann spruce). The subalpine soil has a distinct organic layer, c. 6 cm deep on average, overlying a sandy mineral layer derived from granitic moraine. A more detailed description of the subalpine site is provided elsewhere (Monson et al., 2002; Scott-Denton et al., 2003). The soil measurements were made only on the organic layers, as it was previously observed that this layer accounted for the majority of microbial activity (Scott-Denton et al., 2003). On each sampling date, a minimum of five soil samples were collected, placed in plastic bags and kept cold until analysis. Most of the data herein were derived from soils sampled on Oct 26, 2002 (‘fall’), May 21, 2003 (‘spring’), and July 28, 2003 (‘summer’). The mean air temperature for the week prior to sampling was −0.1, 4.6 and 15.6°C for the three dates, respectively.
Environmental and soil characteristics of alpine dry meadow and subalpine forest sites used in this study
| Variable | Alpine | Subalpine |
| Elevation (m) | 3550 | 3050 |
| Air temp. (°C) | ||
| Min. annual | −26.25 (3.59) | −26.64 (3.32) |
| Max. annual | 19.13 (1.75) | 27.64 (2.17) |
| Mean annual | −1.64 (0.45) | 2.46 (0.49) |
| Max snow accum. (cm) | 55.4 (22.1) | 123.0 (27.2) |
| pH | 4.88 (0.29) | 3.48 (0.41) |
| Organic matter (%) | 18.32 (7.03) | 62.7 (17.4) |
| Field capacity (g H2O g−1 soil) | 0.712 (0.041) | 3.35 (0.73) |
| Extractable org. C (μg C g−1) | 107.6 (51.8) | 1292 (1272) |
Temperature data are means of annual data from 1988–2004. Snow data are from 1982–2005. (Climate data courtesy of Niwot Ridge LTER). Unless otherwise noted, values are means and SDs.
The alpine dry meadow site (40°03′ N, 105°35 W) is dominated by the tussock-forming sedge, Kobresia myosuroides (Vill) Paol. and Fiori. The soil is classified as a skeletal-loamy pergelic Cryumbrept (Burns, 1980). The soil is particularly shallow, with a 10-cm A horizon overlaying a rocky B horizon. All experiments herein were performed on A horizon soil. The alpine study site is described in detail elsewhere (Raab et al., 1999; Lipson & Schmidt, 2004). The soils used in this study were collected on March 19, 1999 (‘Winter’), June 4, 1999 (‘spring’), and June 21, 1999 (‘summer’). The mean air temperature for the week prior to sampling was −3.4, 3.1 and 5.9°C for the three dates, respectively. The winter samples were collected from under snow, when soils were frozen, the spring samples were collected shortly after snow receded from the site and soils thawed, and the summer samples were collected after minimum daily air temperatures had warmed significantly and the daily minimum temperatures were consistently above freezing. These samples are useful for seasonal comparisons, despite the relatively short sampling intervals, as previous research in the alpine has shown that soil environmental conditions, microbial biomass and community structure vary dynamically during these intervals (Lipson et al., 1999; 2002; Lipson & Schmidt, 2004). In particular, the period during snowmelt (‘spring’) shows a large turnover of microbial biomass and nutrients (Lipson et al., 1999). On each sampling date, three replicate soil cores were collected randomly across the meadow.
Temperature responses of soil respiration

16S rRNA gene clone libraries
For the alpine soils, the extraction of DNA, PCR amplification of 16S rRNA genes using universal bacterial primers, construction of clone libraries, and sequencing of clones is described in detail elsewhere (Lipson & Schmidt, 2004). Preparation of subalpine clone libraries was carried out similarly, with the following modifications: DNA was extracted from soils using a modified bead-beating and alkaline lysis procedure. Approximately 5 g soil, 1 g silicon-zirconium beads (BioSpec Products) and 10 mL lysis buffer (10 mM Tris, pH 8.0%, 1.5% sodium dodecylsulfate) were vortexed at high speed for 2 min, followed by a standard alkaline lysis protocol (Ausebel, 1994). DNA was purified by gel electrophoresis, using Qiaex II resin (Qiagen). The 16S rRNA gene was amplified by PCR using the universal bacterial primers, f8 and r1510, and PCR conditions as described earlier (Lipson & Schmidt, 2004). Gel-purified PCR products (about 1500 bp in length) were cloned using Topo TA cloning kits (Invitrogen). For the alpine clone libraries, three separate clone libraries were made for each sampling date using the three spatial replicates (Lipson & Schmidt, 2004). For the subalpine clone libraries, four spatially replicated clone libraries were made for fall, but for spring and summer the spatial replicates (five each) were pooled after the PCR step into a single clone library to conserve resources. In all analyses herein, spatial replicates are pooled by season. Cloned genes were partially sequenced using the universal bacterial primer, r1111 (Lipson & Schmidt, 2004). Only sequences at least 500 bp in length were used for phylogenetic analysis. The original clone libraries contained 185 sequences for the alpine (61, 63 and 61 for winter, spring and summer, respectively), and 152 sequences for the subalpine (68, 34 and 50 for fall, spring and summer, respectively). After removal of duplicate sequences (those sharing 97% or greater similarity – see below), sequences were submitted to GenBank (alpine: AY192197–AY192355, subalpine: DQ516399–DQ516522). The Alpine bacterial community was described previously by Lipson & Schmidt (2004), and are included herein for comparative purposes.
Phylogenetic and statistical analysis
Sequences were aligned using the NAST aligner available on the greengenes web site (greengenes.lbl.gov). Neighbor-joining and maximum likelihood phylogenetic trees were made using BioEdit (http://www.mbio.ncsu.edu/BioEdit/bioedit.html). Sequences sharing 97% or more similarity were considered the same operational taxonomic unit (OTU). Rarefaction analysis was performed using EstimateS (Colwell, 1997), which generates the Chao1 richness estimate (Chao, 1984; Chao et al., 1993). Rank abundance curves were also plotted and fitted with power functions using nonlinear regression. Phylogenetic differences between communities were tested using PTP analysis and the Fst statistic (Martin, 2002). PAUP was used for PTP analysis, and Arlequin (anthro.unige.ch/arlequin/) was used to determine Fst. PTP analysis tests the null hypothesis that the samples are random subsamples of the same community by comparing the original tree to a probability distribution made from multiple random permutations of the tree. Fst estimates the ratio of between-community diversity to total diversity, producing a value from 0 to 1. As in PTP analysis, the significance of the Fst value is generated by comparing the actual value to a distribution generated by randomly permuting the tree. The PTP and Fst tests rely mainly on phylogenetic relationships among sequences, and so are less subject to PCR bias than comparisons of communities based purely on the frequencies of ribotypes in clone libraries. To relate phylogenetic differences among samples to differences in temperature response, principal component analysis (PCA) was performed on the Fst data. The Fst analysis created a 6 × 6 matrix of pairwise distances between communities, and PCA was used to reduce these six dimensions down to a manageable number of principle components that explain the majority of variance in the Fst data set. The first principle component was then regressed on Q10 data using linear regression (after log-transformation of the Q10 data). The software used for these analyses were systat and statview. Probability (P) values are herein referred to as significant if P<0.05, and marginally significant if 0.05≤P<0.10.
Results
Overall broad-level differences between subalpine and alpine bacterial communities
Bacterial 16S rRNA gene clone libraries from alpine and subalpine communities, pooled across all seasons, differ in the overall frequency of some major bacterial groups (Fig. 1). There are similar proportions of Acidobacteria and Proteobacteria, however the relative proportions of Proteobacteria subgroups differ between the two environments. The Alpha, Beta and Gammaproteobacteria subgroups exist in roughly equal proportions in the subalpine clone libraries, but in the alpine they decrease in the order α>β>γ. The alpine libraries have higher proportions of Verrucomicrobia and Actinobacteria, and also higher incidences of miscellaneous rare groups (included in ‘other’, Fig. 1) such as Deltaproteobacteria, the green nonsulfur phylum, the OP10 candidate division and the novel uncultured groups SAM and SPAM (Lipson & Schmidt, 2004). It is also notable that seasonal variation in most major groups was higher among the subalpine clone libraries, evidenced by the larger error bars on Fig. 1, which represent the SDs of the three seasons.
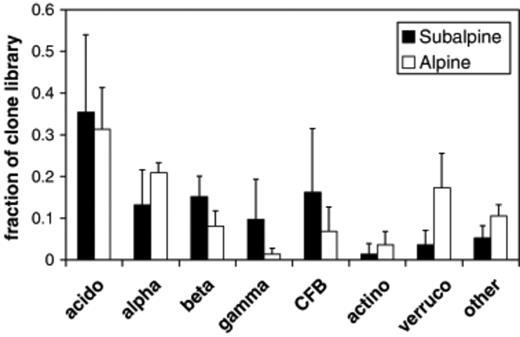
Overall frequency and seasonal variation of major bacterial groups in alpine and subalpine clone libraries. (acido, Acidobacteria; alpha, Alphaproteobacteria; beta, Betaproteobacteria; gamma, Gammaproteobacteria; CFB, Cytophaga–Flexibacter–Bacteroides group (a.k.a. Bacteroidetes); actino, Actinobacteria; Verruco, Verrucomicrobium). Values are means and SDs of three seasons. Alpine data is from Lipson & Schmidt (2004).
Seasonal patterns in alpine and subalpine bacterial communities
Seasonal variations in alpine bacterial communities have been reported previously (Lipson & Schmidt, 2004), but are reported here for comparative purposes (Fig. 2a). In the alpine clone libraries, Acidobacteria peaked during spring, Actinobacteria and Bacteroidetes (‘CFB’) were most abundant during winter, while Verrucomicrobia and Betaproteobacteria were most common in summer. The subalpine clone libraries showed contrasting patterns, with some similarities to the alpine (Fig. 2b). As in the alpine, Acidobacteria were most prominent during the spring. In the summer, there were steep declines in Acidobacteria and Gammaproteobacteria and corresponding increases in the frequency of CFB Alpha, and Betaproteobacteria. The phylogenetic differences among seasons (Table 2) are consistent with the seasonal differences in broad-level community structure shown in Fig. 2. The Fst parameter, which can be interpreted as a pairwise distance between communities, shows that the alpine spring community was most divergent from the winter and summer alpine libraries, which differed more subtly from each other. In the subalpine, spring and fall communities were fairly similar, while the composition of the summer was most divergent. The PTP and Fst analyses produced similar results, with the PTP analysis generally producing slightly more significant results (Table 2).
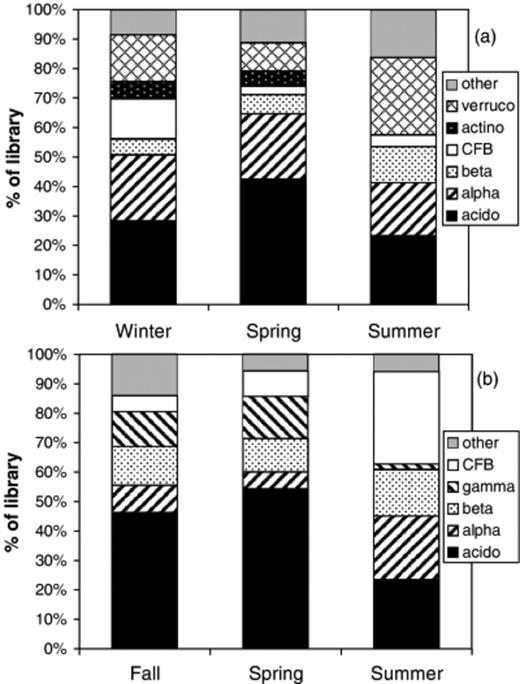
Seasonal changes in the frequency of major bacterial groups in clone libraries from alpine (a) and subalpine (b) soils. See Fig. 1 for abbreviations. Alpine data is from Lipson & Schmidt (2004).
Comparison of overall alpine and subalpine bacterial communities and between seasons within alpine and subalpine communities using PTP and Fst analyses
| Comparison | P(PTP)* | Fst | P(Fst)† |
| Alpine vs. Subalpine | <0.001 | 0.0027 | <0.001 |
| Alpine | |||
| Winter vs. Spring | 0.041 | 0.0019 | 0.088 |
| Spring vs. Summer | 0.025 | 0.0027 | 0.027 |
| Winter vs. Summer | 0.342 | 0.0006 | 0.324 |
| Subalpine | |||
| Fall vs. Spring | 0.969 | 0.0000 | 0.826 |
| Spring vs. Summer | 0.015 | 0.0104 | 0.054 |
| Fall vs. Summer | 0.026 | 0.0086 | 0.011 |
P value for PTP analysis.
P value for Fst analysis.
Temperature responses in alpine and subalpine soils
Except during the winter, SIR in subalpine soils was more temperature sensitive than in alpine soils, as shown by the consistently lower Q10 in alpine soils (Fig. 3). This difference arose because alpine soils had consistently higher proportional activity at low temperatures (0–4°C). Subalpine soils exhibited extreme seasonal variations in Q10, with the highest value occurring in summer. Seasonal fluctuations in alpine Q10 were extremely subtle, with the lowest values in winter.
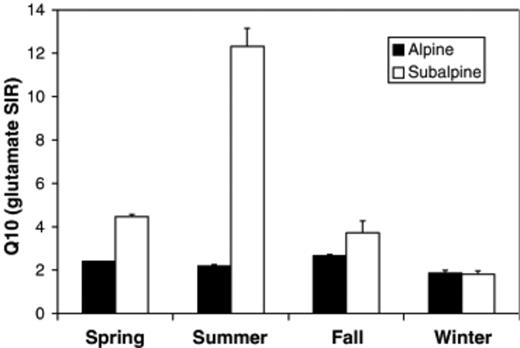
Temperature responses (expressed as Q10) of glutamate substrate-induced respiration (SIR) in alpine and subalpine soils. Data are pooled by season. Means and SEs are shown. Alpine Q10 values were calculated from data in Lipson et al. (1999).
Phylogenetic differences between alpine and subalpine bacterial communities
The PTP and Fst analyses show that overall differences between alpine and subalpine communities were highly significant (Table 2). The differences between the two ecosystems vary by season (Table 3). Based on Fst values, the subalpine communities diverged more from the alpine communities with increasing temperature, with the summer subalpine community the most divergent, and the fall community the most similar. In fact, the subalpine fall community was not significantly different from the alpine winter community, and only marginally significantly different from the alpine spring community (Table 3). This pattern can be seen in the phylogenetic trees shown in Figs 4567. For example, within the Acidobacterium phylum alpine and subalpine sequences are generally clustered into separate subgroups (Fig. 4). However, most of the cases in which alpine and subalpine sequences co-occur in the same clade involve fall or spring subalpine sequences (see groups 2, 3 and 6 in Fig. 4). In contrast, all summer Acidobacterial sequences are clustered in group 1 with only a small number of alpine sequences. The PTP analysis confirms that the alpine and subalpine Acidobacterial communities are highly distinct (P=0.0001). The Proteobacteria are also significantly different between the two ecosystems (P=0.0031), though the clustering is less dramatic (Fig. 5). Again, several clades that contain both alpine and subalpine sequence contain only fall or spring subalpine sequences, and many of the summer subalpine bacteria are on distinct branches. Similarly, the majority of subalpine summer Bacteroidetes sequences were distinct from those of the alpine, though the PTP analysis showed only marginally significant difference between alpine and subalpine communities for this phylum (P=0.063, Fig. 6). Only a small number of sequences of the Verrucomicrobium phylum were recovered from subalpine libraries (Fig. 7). These were within the same general clade as the majority of the alpine Verrucomicobia sequences, though they were distinct from the cluster that forms the most abundant OTU in alpine clone libraries.
Fst values and the P-value indicating the significance of each Fst value for pairwise comparisons between seasonal bacterial communities of alpine and subalpine soils
| Subalpine | |||||||
| Fst values | P-values | ||||||
| Fall | Spring | Summer | Fall | Spring | Summer | ||
| Alpine | Winter | 0.0011 | 0.0039 | 0.0054 | 0.142 | 0.004 | 0.000 |
| Spring | 0.0016 | 0.0037 | 0.0052 | 0.080 | 0.041 | 0.002 | |
| Summer | 0.0022 | 0.0046 | 0.0062 | 0.027 | 0.012 | 0.001 | |
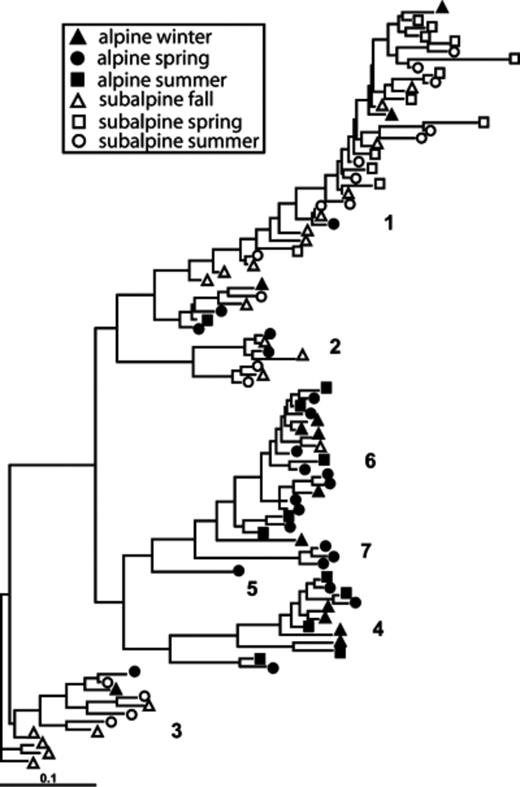
Maximum likelihood tree of Acidobacteria from alpine and subalpine clone libraries. Numbered subgroups follow Ludwig et al. (1997).
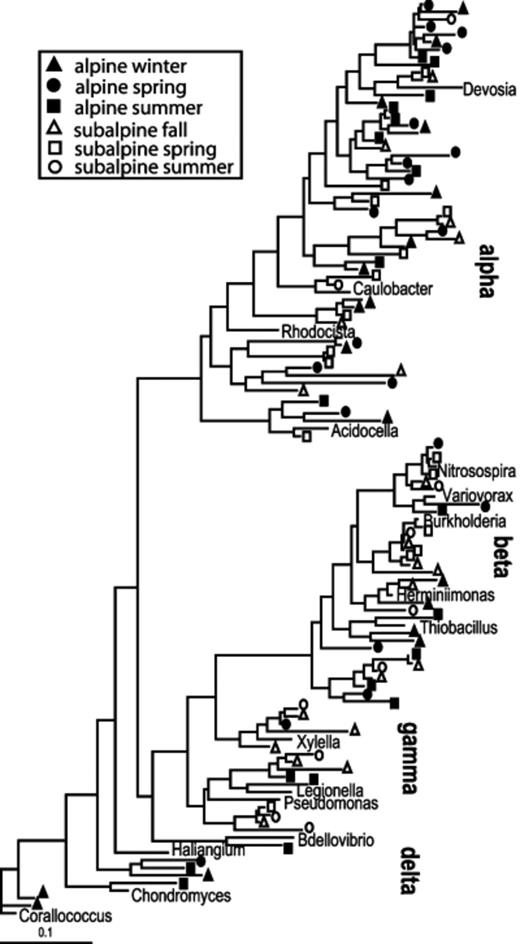
Maximum likelihood tree of Proteobacteria 16S rRNA gene sequences from alpine and subalpine clone libraries.
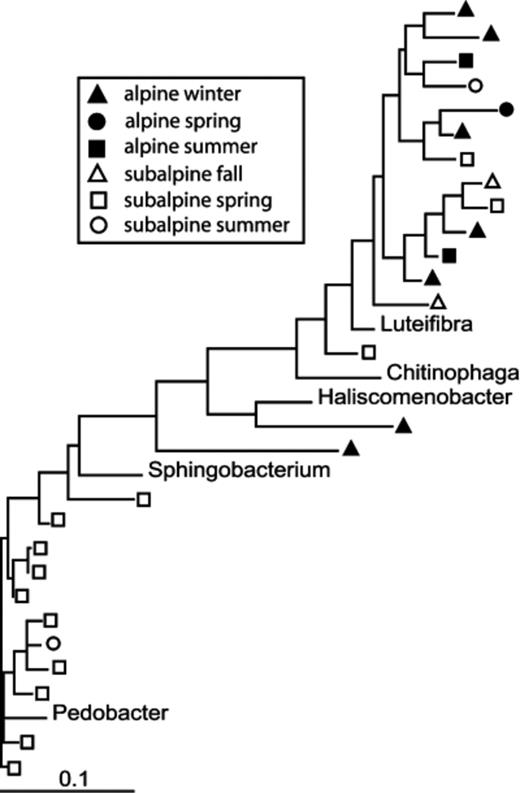
Maximum likelihood tree of Bacteroidetes (CFB) 16S rRNA gene sequences from alpine and subalpine clone libraries.
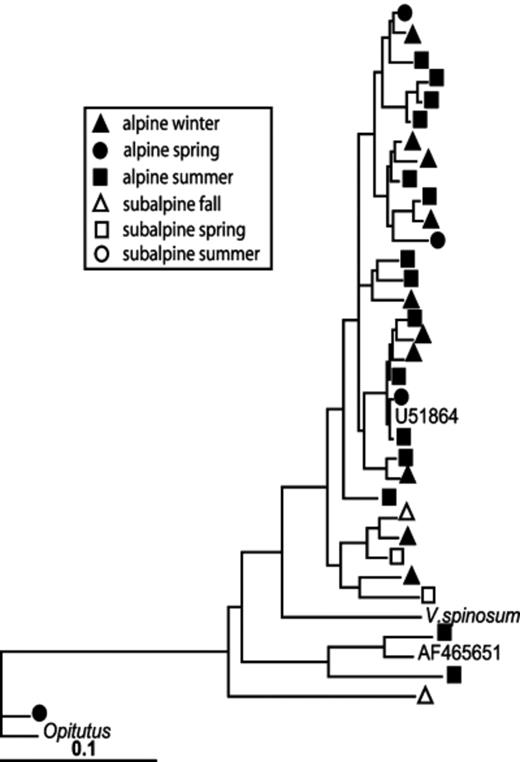
Maximum likelihood tree of Verrucomicrobia 16S rRNA gene sequences from alpine and subalpine clone libraries.
Rarefaction analysis of alpine and subalpine bacterial communities
Removal of sequences with 97% or higher similarity produced 150 and 110 distinct OTU for the alpine and subalpine clone libraries, respectively. Based on Chao1 estimates, this represents 30% and 27% coverage for the two communities. Bacterial communities from the two ecosystems had broadly similar patterns of OTU richness (Fig. 8). The Chao1 and power equations indicate that the subalpine bacterial community is slightly less diverse than that of the alpine. The differences in Chao1 estimates were not significantly different between alpine and subalpine communities. However, the parameter estimates for the power-law curves differed significantly. Both alpine and subalpine libraries have abundant OTU that appear up to six times. The most abundant alpine OTU is an uncultured Verrucomicrobium (Lipson & Schmidt, 2004). The three most abundant OTU in the subalpine are a Burkholderia species, an uncultured Gammaproteobacterium, and an uncultured Acidobacterium (Figs 4 and 5). Of the 150 alpine OTU and the 110 subalpine OTU, only nine are found in both ecosystems. Of the subalpine OTU that are also found in the alpine, five are from fall, one is from spring and three are from summer.
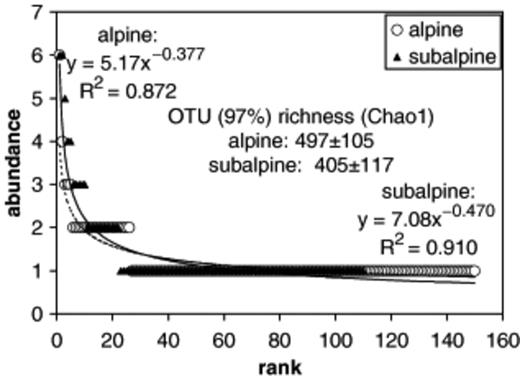
Rarefaction analysis of alpine and subalpine clone libraries. The abundance of ribotypes, defined at a 97% sequence similarity level, is plotted with decreasing rank. Curves are fitted with power law equations, and with the Chao1 richness estimator.
Relationships between community structure and temperature responses
PCA of Fst values produced two principle components, Factors 1 and 2, which accounted for 69% and 22% of the variance in the data set, respectively, and 91% collectively. The first principle component for each community was significantly related to the Q10 obtained from the same season (Fig. 9a). The multiple regression model that related the log-transformed Q10 values to both PCA factors was also significant (R2=0.931, P=0.018), and the partial P values for the two factors show that Factor 1 was significant (P=0.010), while Factor 2 was marginally significant (P=0.094). The log-transformed Q10 values were also positively related to the proportion of Betaproteobacteria in the libraries (Fig. 9b). A similar positive relationship was found between Q10 and the CFB group, though this regression was only marginally significant (R2=0.598, P=0.075).
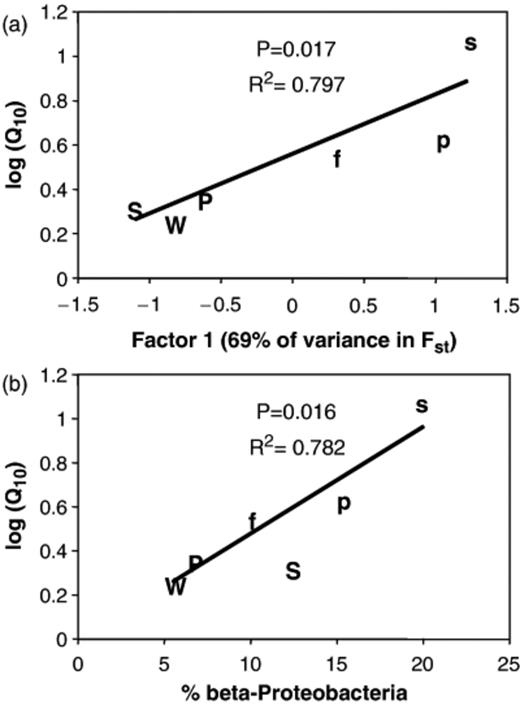
Relationships between bacterial community structure and temperature responses (Q10) of substrate-induced respiration (SIR) in alpine and subalpine soils. Log-transformed Q10 values regressed against (a) the first factor produced in principal component analysis (PCA) of the Fst data, and (b) the percentage of Betaproteobacteria in each library. Upper case W, P and S refer to alpine winter, spring and summer libraries; lower case f, p and s refer to subalpine fall, spring and summer libraries.
Discussion
Soils from the alpine dry meadow and the subalpine forest had strikingly different responses to temperature in their SIR activity. The alpine soil microbial community is clearly cold-adapted throughout the year, whereas the temperature preferences of the subalpine community change dynamically with season. This is consistent with previous observations. Alpine soils consistently produced a substrate-induced growth response at 3°C throughout the entire year (Lipson et al., 1999), whereas a growth response at 0–4°C was only seen in the subalpine in late winter under a deep snow pack (Monson et al., 2006). Despite the subtle seasonal changes in Q10 presented here, seasonal shifts in the temperature responses of alpine soil respiration have been reported (Lipson et al., 2002). However, the subalpine forest soil clearly undergoes much more drastic seasonal shifts in respiratory temperature responses. In part, this could be attributed to the warmer temperatures in the lower elevation forest. Microbial communities appear to be well-adapted to ambient temperatures in their ecosystems (Giardina & Ryan, 2000), and communities may acclimate quickly to altered temperature regimes (Luo et al., 2001). However, the c. 4°C difference in mean annual temperature between the two ecosystems is probably not the only driving force behind these striking differences in how microbial activity responds to temperature. Daily minimum temperatures below 4°C are common in the subalpine during most of the year, yet soil respiration is not generally optimized for these low temperatures. The microbial population dynamics in the alpine are largely driven by changes in C availability (Lipson et al., 2000). Plant senescence in fall provides fuel for microbial growth during the winter, allowing microbial biomass to peak before snow melts in spring. At that time, choice substrates such as cellulose are depleted, and the warm temperatures further increase microbial C demand, leading to a steep decline in biomass after snow melt (Brooks et al., 1998; Lipson et al., 1999, 2000). However, in the organic soils of the subalpine forest, there are consistently higher levels of available C (see Table 1), and heterotrophic activity is relatively unconstrained by C availability (Scott-Denton et al., 2006). A less C-limited subalpine community will respond more to other environmental variables, such as temperature. Given high concentrations of organic C, communities will be selected to grow well at ambient temperatures, whereas in alpine summers there is less selection pressure to grow rapidly due to limited resources. These differences in C availability explain the more extreme biomass dynamics in the alpine coupled with more subtle changes in Q10 compared to the subalpine, in which biomass changes less between summer and winter (Monson et al., 2006), but Q10 fluctuates more. This may also be reflected in the larger seasonal variation in community structure observed at the broad taxonomic level in the subalpine (see larger error bars in Fig. 1, seasonal changes in Fig. 2).
Despite the close geographic proximity of the meadow and forest, the two ecosystems harbor very distinct microbial communities. In addition to the effects of temperature and soil OM discussed above, the lower pH in the subalpine forest soil is likely to have a strong influence on microbial community structure. This variable was determined to have the largest influence in predicting microbial diversity and community structure across the continental United States (Fierer & Jackson, 2006). The organic-rich subalpine soil likely contains higher nutrient levels than the alpine soil. However, there is evidence that N does not limit microbial activity or biomass in the alpine (Schmidt et al., 2004).
The subalpine forest is located 5 km directly down-slope of the alpine meadow, and the high winds at Niwot Ridge probably introduce species between the two locations frequently. However, only a small number of OTU were found at both locations. This, and the distinct phylogenetic patterns for the two ecosystems shown in Figs 4567, suggests that successful invasions of the adjacent community are relatively rare, and that these communities are fairly specialized to their respective environments. Higher coverage of alpine and subalpine bacterial diversity would help elucidate this issue.
The analysis presented here combines two studies that differ somewhat in methodology. The samples from the alpine and subalpine environments were collected at different times of the year. However, the sampling dates for both environments represent strong seasonal gradients that include periods with frozen and unfrozen soils, allowing meaningful comparisons of seasonal variation between the two ecosystems. Because the sites vary in their seasonality (timing of snowmelt, etc.), it would be meaningless to match up dates exactly between the two systems. The soils for the two studies were also collected in different years. However, the climatic differences between the two sites are greater than typical interannual variability for either ecosystem (compare SDs to site differences in Table 1), and so the differences between alpine and subalpine microbial communities reported herein are unlikely to be artifacts of year-to-year variability. Another difference between the subalpine and alpine studies is that DNA was extracted from soil using slightly different techniques, which could lead to differences between the clone libraries (Martin-Laurent et al., 2001). However, in both cases the methods used were optimized to maximize yield and purity of DNA extraction. Given the large differences between the two soil types, this approach may be more logical than applying the same method to extract two different soil types. Furthermore, the same PCR primers and cloning methods were used to produce the two clone libraries. Despite any systematic bias due to methodological differences between the two studies, communities in the subalpine ranged seasonally from being highly similar to distinctly different from those in the alpine. Most importantly for the purposes of this paper, variations in community structure among all samples, regardless of their cause, were related to changes in Q10. The value of integrating these two divergent studies into a more meaningful, larger context outweighs the difficulties arising from methodological differences between the studies.
Among the communities examined in this study there was a strong link between bacterial community structure and the SIR temperature response. Soils with contrasting Q10 show distinct phylogenetic patterns, allowing the possibility that specific clades represent bacteria with similar temperature responses. This argument is strengthened by the observation that the subalpine community sampled when soil was frozen (fall) was most similar to the alpine communities, while the more mesophilic, summer subalpine community was most different from the alpine communities (Table 3). However, the most vivid evidence is the linear relationship between log(Q10) and bacterial community structure, as expressed by the factor analysis of Fst comparisons among communities (Fig. 9). Such explicit, quantitative connections between community structure and function are rare, but obtainable when one is fortunate. For example, Lipson et al. (2006) found linear relationships between microbial community structure and soil processes such as SIR and enzyme activity in an artificial ecosystem at Biosphere 2. In the current study it was particularly satisfying that in the multiple regression the two PCA factors, which together accounted for 91% of the genetic variance among communities, explained 93% of the variation in log(Q10). This tight connection between overall phylogenetic structure and microbial temperature means that phylogenetic differences between communities translate into changes in function. Thus there is a high probability that the distinct clades found in a given community contribute to the overall temperature sensitivity of that soil.
The seasonal and altitudinal patterns in Q10 presented here are consistent with recent studies on the potential effects of global climate change on microbial activity. It appears that microbial communities are generally well adapted to their ambient temperature regimes. Mean annual temperatures do not strongly affect decomposition rates over a wide range of ecosystem types (Giardina & Ryan, 2000). Furthermore, microbial activity has been observed to acclimate quickly to experimental warming, either by changes in community structure or substrate availability (Luo et al., 2001). Therefore, changes in soil respiration in response to temperature changes may be buffered somewhat by adaptations of the microbial communities. However, the present study also shows that microbial respiratory properties vary greatly between alpine and subalpine environments, and so climate-induced changes in tree line are likely to have large impacts on ecosystem respiration.
Frequencies of ribotypes in 16S rRNA gene clone libraries do not correspond exactly to the original abundance in soils due to PCR bias and other effects (Kanagawa, 2003). However, the linear relationship between the frequency of Betaproteobacteria sequences and Q10 strongly suggests that such measures are not completely meaningless. Linear relationships between the abundance of certain ribotypes in clone libraries and soil process rates have been reported previously (Lipson et al., 2006). The relationship between Q10 and Betaproteobacteria is probably driven largely by the predominance of Burkholderia, the most abundant subalpine OTU, especially in the summer. This species has been successfully isolated into pure culture, and these strains grow quite poorly at low temperatures, producing a significantly higher Q10 than bacteria isolated from winter soils (Lipson, unpublished data). However, other Betaproteobacteria strains isolated from the subalpine and other cold regions, such as Janthinobacterium, Variovorax and even other Burkholderia strains, are psychrotolerant (Pearce et al., 2003; Segawa et al., 2005; Monson et al., 2006) and so it is not correct to generalize the relationship observed in Fig. 9b to mean that Betaproteobacteria lead to a higher Q10 in soils. It does, however, serve to reinforce the connection between community structure and function in this ecosystem, and shows further that a narrow group of bacteria can have a measurable impact on soil functioning.
Acknowledgements
The author gratefully acknowledges Rosa Margesin and Max Häggblom for organizing and editing this special volume, and three anonymous reviewers for their suggestions. The Niwot Ridge LTER provided climatological and soil data to this project. Funding for this project was provided in part by NSF grant IBN-0212267. Thanks also to Michael Weintraub and Laura Scott-Denton for assistance with field work.
References
Author notes
Editor: Max Haggblom
