


Prolonged lack of enteral feeding has a negative impact on gut physiology, potentially via microbiota modulation. The aims were to investigate the impact of fasting and post-prandial changes in canine jejunal microbiota. To study post-prandial effects, jejunal brushings were analyzed in 8 healthy fistulated dogs 15 min before feeding (baseline) and hourly for 8 h after feeding. To study effects of withholding food (WF), daily samples were collected for 15 days from 5 dogs. The first 5 days (PRE) dogs were fed regular diet. Food was withheld the next 5 days (days 6–10). For days 11–15 (POST), the original diet was reintroduced. Microbiota was characterized via denaturing gradient gel electrophoresis and 454-pyrosequencing of 16S rRNA genes. In the post-prandial study, no changes in microbiome structure were seen after feeding (ANOSIM, P = 0.28), but Betaproteobacteria (P = 0.04) and Bacteroidales decreased compared to baseline. Species richness decreased by 300 min (P = 0.04). During WF, microbiota structure differed from PRE and POST period (P = 0.001). During WF, species richness did not vary over time (P = 0.69). In conclusion, a prolonged period of food withholding results in altered jejunal microbiota. How these changes affect the microbiota metabolism warrants further studies.
ABBREVIATIONS
- 16SrRNA:
16S ribosomal RNA
- ANOSIM:
Analysis of similarities
- DGGE:
Denaturing gradient gel electrophoresis
- FDR:
False Discovery Rate
- GI:
Gastrointestinal
- KEGG:
Kyoto Encyclopedia of Genes and Genomes
- LEfSe:
Linear discriminant analysis (LDA) effect size
- PCoA:
Principal coordinates analysis
- PICRUSt:
Phylogenetic Investigation of Communities by Reconstruction of Unobserved States
- WF:
Withholding food
INTRODUCTION
The small intestinal microbiota is an important modulator of the immune system in mammals (Suchodolski 2011) and is also a major site of inflammation and microbiota changes in chronic gastrointestinal (GI) inflammation (Suchodolski et al.2012). Environmental factors, such as dietary components, proton-pump inhibitors, antibiotics and infectious organisms, can all lead to alterations in small intestinal microbiota structure and/or species richness (Suchodolski et al.2009; Garcia-Mazcorro et al.2012). These alterations may have either a direct negative consequence of host health, or they may become a potential risk factor in multi-factorial disease processes, such as inflammatory bowel disease (IBD). A better understanding on various environmental triggers that cause microbiota alterations is needed. In general, dogs have a similar intestinal microbiota compared to humans, and dogs also suffer from similar chronic diseases that are associated with alterations in gut microbiota (e.g. IBD, obesity and diabetes mellitus). For example, changes in small and large intestinal microbiota have been described in dogs with IBD and acute diarrhea (Suchodolski et al.2012; Rossi et al.2014; Guard et al.2015), which are also associated with metabolic and histological alterations. Similar to humans with IBD, the major changes are decreases in members of Firmicutes and concurrent increases in Proteobacteria (Honneffer, Minamoto and Suchodolski 2014). While it is well documented that dietary components may shape the gut microbiota (Beloshapka et al.2013; Panasevich et al.2014), little is known about the immediate post-prandial period and how prolonged withholding of food shapes the small intestinal microbial ecosystem, especially in mammals. Prolonged lack of enteral feeding may have negative impact on gut physiology as reintroducing food sooner enhances recovery time in various diseases, potentially via modulation of gut microbiota (Mohr et al.2003; Mansfield et al.2011; Gerritsen et al.2014). Prolonged periods of non-feeding may occur before scheduled endoscopy, but it also may occur because of anorexia as part of the underlying GI disease. Furthermore, in episodes of acute vomiting and/or diarrhea, withholding food (WF) for 24–48 h is sometimes recommended as therapy by veterinary practitioners. Therefore, understanding how the microbiota changes post-prandially or during an unfed state is of interest.
Microbiota changes in the large intestine were identified in snakes not fed for >30 days (Costello et al.2010), in the cecum of hamsters not fed for 96 h (Sonoyama et al.2009), and in ceca of mice not fed for 24 h (Crawford et al.2009). Only limited data are available characterizing the small intestinal microbiota of mammals that underwent prolonged periods without food intake. The aims of this study were to investigate (i) post-prandial effects and (ii) the impact of WF on the jejunal microbiota of dogs by DGGE and 16S rRNA gene pyrosequencing. Because we sampled the jejunal microbiota from healthy Beagle dogs with a jejunal fistula, this allowed for repeated sampling from the same animal.
MATERIALS AND METHODS
Animals and sample collection
The study was divided into two parts: (i) to evaluate the post-prandial effects and (ii) to evaluate the effect of WF on the small intestinal microbiota. A total of eight laboratory Beagle dogs, each with a pre-existing jejunal fistula were used in this study. The fistulas were implanted several years before this study, and dogs were considered well adapted to the fistula (Harmoinen et al.2001; Suchodolski et al.2009). These dogs were considered healthy and had no recent history of GI disease. Age of the dogs ranged from 6 to 7 years, body weights from 9 to 13 kg, and their body condition scores ranged from 3 to 4 on a 9-point scale. The dogs received a commercial dry dog food (Mastery Adult Essential Maintenance, Vauvert, France) twice a day throughout the study period (28% crude protein, 20% crude fat, 7% crude ash and 2.5% crude fiber). The dogs were kept in the same facilities at the laboratory animal unit, in the Faculty of Veterinary Medicine, University of Helsinki, Finland. The dogs were taken care of by the same personnel, but they were housed, fed and treated singly (i.e. each dog lived in its own pen, and went outdoors by itself). The temperature in the room was ∼20°C to 22°C and the room was artificially illuminated from 7 a.m. to 9 p.m.
Mucosal brush samples were collected by advancing a disposable sterile cytology brush (Disposable Cytology Brushes, 1.7 mm × 160 cm, Horizons International Corp., Puerto Rico) introduced through the fistula as described previously (Suchodolski et al.2004, 2009). To ensure consistency in sample collection, the same person collected all the samples during the whole study period. Furthermore, the samples were obtained according to a timetable with each sample collected exactly at the same time (i.e. the first sample was obtained at 8AM). Samples were homogenized, properly labeled and immediately frozen and stored at −80°C for ∼2 months until DNA extraction. The experimental protocol had been approved by the local ethics committee for animal experiment action in Helsinki, Finland.
Evaluation of post-prandial changes
For this part of the study, samples were collected from eight dogs. These samples were collected at 9 time points from all dogs. First 2 baseline samples were collected, one 30 min and the second 15 min before the dogs were fed. Additional samples were collected at 1, 2, 3, 4, 5, 6 and 8 h after feeding. The microbiota in all samples were analyzed by DGGE and a subset of time-points (15 min before, 1 h and 5 h) from 4 dogs were analyzed by 454-pyrosequencing of 16S rRNA genes.
Effect of WF
For this part of the study, samples were collected from 5 dogs daily over a period of 15 days. The first five days (baseline period, PRE), dogs were fed a maintenance diet. Food was withheld (WF period) for the next five days with unrestricted water access. For days 11–15, dogs were refed with the original diet (POST). The samples were collected 1 h after feeding in the PRE and POST periods, because in these periods additional samples were collected for another unrelated study. In the unfed period (WF), the samples were collected at the same time from each individual each day as was scheduled after feeding. Normal tap water was given ad libitum during the entire study. Clinical examination was also performed throughout the study period, and Na, K, PCV, glucose, total proteins, albumin and urea were determined from blood sample twice daily. The microbiota in all samples were analyzed by DGGE and a subset of time-points by 454-pyrosequencing of 16S rRNA genes: days 3 and 5 (PRE), days 6, 7 and 9 (WF) and days 12 and 15 (POST).
DNA extraction
Genomic DNA was extracted individually from all samples using a modified bead beating method followed by phenol:chloroform:iso-amylalcohol extraction as described previously for canine small intestinal brush samples (Suchodolski, Camacho and Steiner 2008).
DGGE
The DNA was subsequently used as a template to amplify the variable V6–V8 region of 16S rRNA genes with universal bacterial primers F-968-GC (5′-GC-clamp+GAACGCGAAGAACCTTAC-3′) and R-1401 (5′-GGTGTGTACAAGACCC-3′) with PCR conditions as described previously (Suchodolski et al.2004, 2005). The GC-clamp sequence was CGCCCGGGGCGCGCCCCGGGCGGGGCGGGGGCACGGGG. The DGGE analysis was performed on a DGGE system (DCode, Biorad Laboratories, Hercules, CA) according to the manufacturer's instructions. PCR amplicons were applied to 16 × 16 cm, 8% (wt/vol) polyacrylamide gels (acrylamide-bisacrylamide, 37.5:1) in TAE buffer (40 mM Tris-acetate, 1 mM Na2EDTA, [pH 7.4]) with a linear denaturing gradient of 35%–70% (100% of denaturant was defined as 7 M Urea and 40% (vol/vol) deionized formamide). Commercially available DNA ladder (DNA ladder (log2), New England Biolabs Inc., Beverly, MA) was loaded as a marker. Electrophoresis was performed in TAE buffer at 60°C for 16 h at 70 V. Gels were stained with ethidium bromide for 12 min and subsequently destained in H2O two times for 30 min. Gels were scanned (AlphaImager, Alpha Innotech Corporation, San Leandro, CA) and banding patterns were analyzed using gel analysis software (Bionumerics 3.0, Applied Maths, Austin, TX). Similarity indices between the banding patterns were calculated using Dice's similarity coefficient (Dsc = [2j / (a + b)] × 100; where a = number of DGGE bands in lane 1, b = number of DGGE bands in lane 2 and j = number of common DGGE bands; Dsc = 100% demonstrates complete identity) (Suchodolski et al.2004, 2005).
For statistical analysis, the similarity indices and the changes in microbiota banding patterns due to feeding or WF were determined by repeated measures 1-way ANOVA. A P < 0.05 was considered for significance.
454-pyrosequencing
The 16S rRNA genes were amplified with primers 27F (GAGTTTGATCNTGGCTCAG) and 519R (GTNTTACNGCGGCKGCTG) as described previously for small intestinal biopsies obtained from dogs (Suchodolski et al.2009, 2012). Raw sequence data were screened, trimmed, denoised, chimera depleted and filtered using the QIIME pipeline version 1.8.0 (http://qiime.sourceforge.net) with the following settings: minimum read length of 300 bp; no ambiguous base calls; no homopolymeric runs longer than 8 bp; average quality value.q25 within a sliding window of 50 bp. Operational taxonomic units (OTUs) were defined as sequences with at least 97% similarity using QIIME. For classification of sequences on a genus level the naıve Bayesian classifier within the Ribosomal Database Project (RDP, v10.28) was used. The confidence threshold in RDP was set to 80%. The sequencing data have since been deposited into the Sequence Read Archive of the National Center for Biotechnology Information under accession number SRP055377.
The statistical analysis of the sequencing data was performed as follows: to account for unequal sequencing depth across samples, and to avoid exclusion of samples with lower number of sequence reads, the subsequent analysis was performed on a randomly selected subset of 1200 sequences per sample. Differences in microbial communities across time points were determined using the phylogeny-based unweighted UniFrac metric, and Principal Coordinate Analysis (PCoA) plots and rarefaction curves were plotted using QIIME and the analysis of similarities (ANOSIM) was performed on the unweighted UniFrac distance matrixes for statistical analysis. The PICRUSt (Phylogenetic Investigation of Communities by Reconstruction of Unobserved States: http://picrust.github.io/picrust/) was used to predict the functional capabilities of bacteria based on the 16S rRNA gene dataset.
For all datasets, assumption of normality was tested using the D'Agostino and Pearson normality test (Prism v.6.0, GraphPad Software Inc.). Because most datasets did not meet the assumptions of normal distribution, the differences in the proportions of bacterial taxa or predicted metagenomes (defined as percentage of total sequences) between groups were determined using nonparametric Kruskal–Wallis tests (Prism v6, GraphPad Software Inc.). The resulting P-values were corrected for multiple comparisons on each phylogenetic level using the Benjamini & Hochberg's False Discovery Rate, and a P < 0.05 was considered statistically significant. For those bacterial groups that were still significant after P-value adjustment, a Dunns’ post-test was used to determine which time points were significantly different. Linear discriminant analysis (LDA) effect size (LEfSe) was utilized to evaluate differentially abundant bacterial taxa and predicted function between the animal groups.
RESULTS
The dogs tolerated the period of food withholding well. No biochemical or hematological abnormalities were observed over the duration of the study. All the dogs lost weight during the study period, and the weight lost ranged between 100–200 g. However, all the dogs were alert and active during the whole study and weight gain started immediately when feeding was restarted at day 11.
DGGE analysis of jejunal microbial communities
Post-prandial
Feeding led to slight and transient changes in DGGE profiles with consecutive appearance or disappearance of unique bands. The samples from one dog are illustrated in Fig. 1A. Mean ± SD similarity index of DGGE profiles was 74.4 ± 4.9% after feeding and 75.8 ± 5.4% over time. However, there was no significant change in band numbers or similarity indices either post-prandially or over time (P = 0.49).
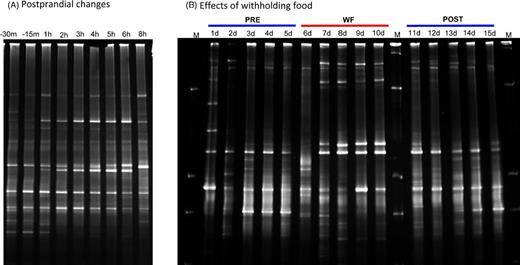
DGGE profiles illustrating effects of feeding (A) and withholding of food (B) on small intestinal microbiota in one dog. These gels are representative for the changes observed in other dogs. m = minutes, h = hours; PRE = days (d) during regular feeding; WF = days during period of withholding food; POST = days during regular feeding; M = marker.
Food withholding
DGGE profiles illustrating the bacterial similarity in the canine jejunum and the variation in bacterial diversity before WF (PRE), during the period of WF and after (POST) are shown in Fig. 1B for one dog. WF led to changes in the jejunal microbiota in DGGE profiles compared to PRE (P < 0.05). The mean (SD) similarity percentages of DGGE profiles PRE, WF and POST are 76.9 (3.1), 57.0 (7.6) and 64.1 (4.6), respectively. The jejunal microbiota at POST returned close to the profile seen PRE.
Sequence analysis
Post-prandial
To characterize the global differences in jejunal microbial communities over time, a PCoA was performed on unweighted UniFrac distances (Fig. 2A), and the ANOSIM revealed no significance in microbiota before (-15 min) and after feeding (P = 0.26). The first three components explained ∼52% of the variation in the data, suggesting that additional variation could be represented by lower PCoA components. However, visual exploration of the lower components using scree plots did not yield any clear additional separation. Similarly, distance plots (Fig. 2C) revealed no significant changes in the microbiota from 60 to 300 min. However, at 300 min after feeding, a reduction in alpha-diversity measures was observed, with the Shannon index significantly decreased compared to 15 min before feeding (Table 1; Fig. 3B and D). Also, Friedman's test revealed significant differences in the number of OTUs between the time points (P = 0.04), but the Dunn's multiple comparison did not reach significance (Table 1).
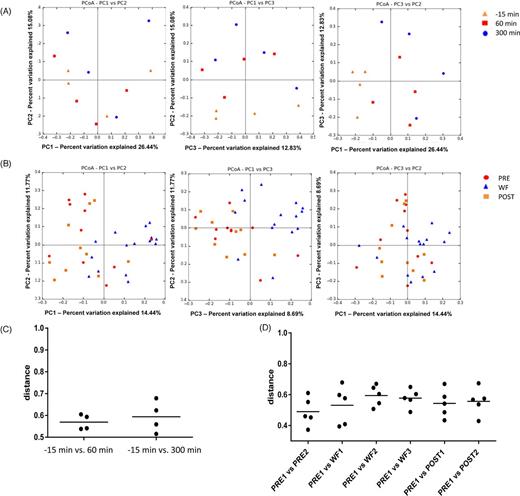
Principal Coordinate Analysis (PCoA) of unweighted UniFrac distances of 16S rRNA genes for the feeding study (A, C) and withholding food part of the study (B, D). The x-axis in panel D refers to the days of the study: days 3 and 5 (PRE), days 6, 7 and 9 (WF) and days 12 and 15 (POST).
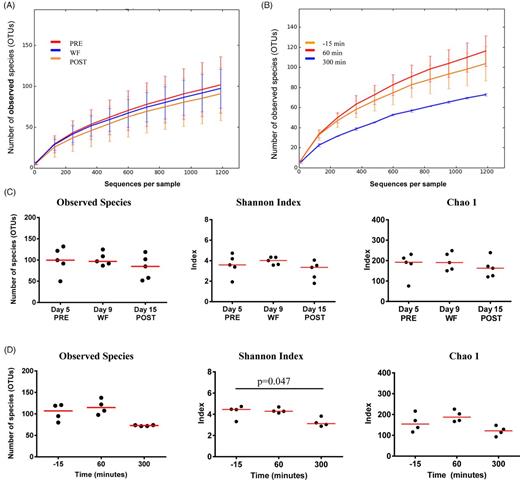
Rarefaction analysis and alpha-diversity measures illustrating effects of feeding (A, C) and withholding of food (B, D). Lines represent the mean and error bars represent standard deviations.
Summary of alpha-diversity measures.
| Before (−15 min) | After (1 h) | After (5 h) | P-value | |
|---|---|---|---|---|
| OTU97 (mean ± SD) | 103.7a ± 19.7 | 116.3a ± 22.7 | 72.9a ± 1.3 | 0.0417 |
| Shannon index (mean ± SD) | 4.2a ± 0.6 | 4.3a,b ± 0.2 | 3.2b ± 0.4 | 0.0417 |
| Chao1 (mean ± SD) | 216.1 ± 43.7 | 191.6 ± 27.7 | 120.8 ± 23.2 | 0.2731 |
| PRE (Day 5) | WF (Day 9) | POST (Day 15) | P-value | |
| OTU97 (mean ± SD) | 87.4 ± 34.9 | 101.7 ± 17.3 | 83.0 ± 28.5 | 0.6914 |
| Shannon index (mean ± SD) | 3.6 ± 1.1 | 4.0 ± 0.4 | 3.0 ± 0.9 | 0.3673 |
| Chao1 (mean ± SD) | 179.2 ± 60.4 | 195.8 ± 50.0 | 164.0 ± 47.4 | 0.5216 |
Before = before feeding; After = after feeding.
PRE = before withholding food; WF = withholding food; POST = after withholding food.
a,bMeans not sharing a common superscript are significantly different (P < 0.05; Dunn's multiple comparisons test).
Significant differences were also detected for bacterial taxa (Table S1, Supporting Information; Fig. 4). Univariant analysis revealed a significant decrease in Proteobacteria (P = 0.023) and especially Burkholderiales (P = 0.0506) within Betaproteobacteria (P = 0.04) at 300 min post-prandial compared to 15 min before feeding. LDA (effect size (LEfSe) was utilized to determine differentially abundant bacterial taxa between time points. Bacteroidales were more abundant before feeding (2.8%) versus 300 min (0.3%), and Actinobacteria were more abundant at 60 min (1.1%) versus baseline and 300 min (0.3% and 0.4%, respectively); however this did not reach statistical significance after adjustment for multiple comparisons (Fig. 4, Table S1, Supporting Information).
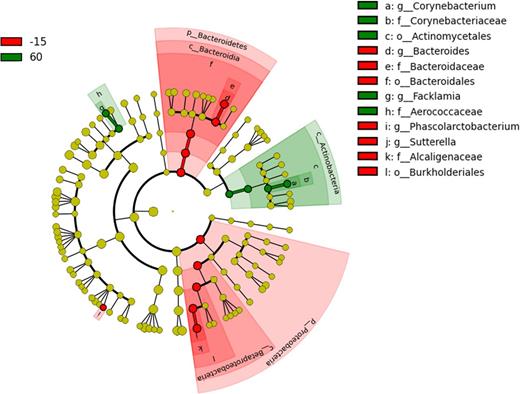
Differentially abundant bacterial groups (based on LEfSe) observed in the post-prandial period. (−15 = 15 min before feeding; 60 = 60 min after feeding; 300 = 300 min after feeding).
Food withholding
The PCoA plots showed significant separation between the jejunal samples of dogs collected during the period of WF compared to PRE (ANOSIM; P = 0.009) and compared to POST (P = 0.001; Fig. 2B and D). The first three components explained ∼33% of the variation in the data. However, visual exploration of the lower components using scree plots did not yield any clear additional separation. There was no significant separation between PRE and POST (P = 0.38). No significant differences were observed for the alpha-diversity measures (Fig. 3A and C).
During periods of WF, several bacterial taxa changed significantly (Fig. 5; Table S2, Supporting Information). During WF, there was a significant increase in Bacteroidaceae (P = 0.01, q = 0.09), Proteobacteria (P = 0.02, q = 0.11) and Fusobacterium within Fusobacteria (P = 0.02, q = 0.22) compared to the PRE and POST periods prior to adjusting for multiple comparisons. In contrast, significant decreases were observed in Erysipelotrichi (P = 0.01, q = 0.09) during WF. LEfSe revealed additional groups within the Firmicutes (76.8% at PRE, 6.80% at WF, 89.3% at POST; P = 0.09, q = 0.15) that were decreased during WF (Fig. 5). These bacterial changes are also illustrated as a heatmap (Fig. 6). Especially Lactobacillaceae (P = 0.0239; q = 0.1195) and Streptococcaceae (P = 0.0293; q = 0.1195) were decreased during WF.
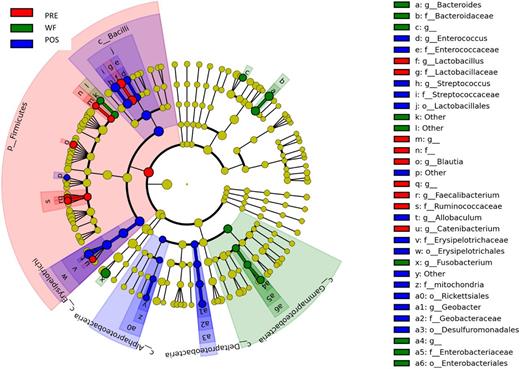
Differentially abundant bacterial groups (based on LEfSe) observed in response to withholding food. PRE = days during regular feeding; WF = days during period of withholding food; POS = days during regular feeding.
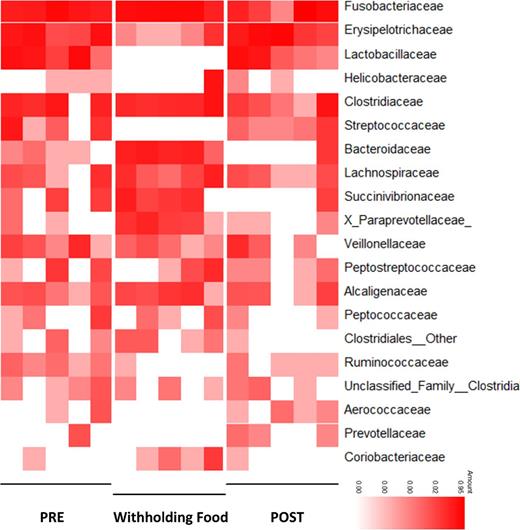
Heatmap illustrating the relative abundance of predominant bacterial families observed in response to withholding food. PRE = days during regular feeding; Withholding Food = days during period of withholding food; POST = days during regular feeding.
Predicted functional composition of jejunal microbial communities
Post-prandial
The PICRUSt results (Table S3, Supporting Information) were then analyzed using LEfSe to identify microbial functions that were significantly different in their abundance between groups. No differentially abundant bacterial functions were observed between the groups before and after feeding (α = 0.01, LDA score > 3.0).
Food withholding
There was one differentially abundant bacterial function observed between the WF and WF-POST groups (α = 0.01, LDA score > 3.0), the function of phosphotransferase system, which was overrepresented in the WF-POST group (Table S4, Supporting Information).
DISCUSSION
The aim of this study was to elucidate the changes in small intestinal microbiota that occur post-prandially in response to regular interval feeding as well as in response to prolonged withholding of food. Because samples in the PRE period of the WF study were collected 1 h after feeding due to technical reasons unrelated to this study, we first evaluated how the small microbiota changes for several hours after feeding compared to before feeding. The DGGE and PCoA plots revealed minor changes at 60 min after feeding, and more pronounced changes at later time points after feeding. The microbial diversity decreased at 300 min and this was also visible on the DGGE plots, where some bands disappeared, especially at the lower parts of the gels, indicating bacteria with higher GC-content. Also, a few bands appeared or existing bands became stronger over time. Sequencing revealed that some bacterial taxa were significantly altered. Betaproteobacteria, especially Burkholderiales, decreased at 300 min. Similarly, LEfSe revealed a decrease in Bacteroidetes, whereas Corynebacteriaceae and Actinomycetales within the phylum Actinobacteria increased at 60 min when compared to before feeding. DGGE gels showed that these alterations are dynamic over time, and at 300 min there was also a significant and clear drop in species richness. Based on the DGGE profiles, at 8 h it appeared that alterations were starting to revert in the direction of microbiota structure as before feeding. Likely explanations for these temporary changes in the microbiota after feeding include an increase in intestinal motility and secretions, and a post-prandial increase in availability of various macro- and micro-nutrients and fermentable substrates such as fibers for subgroups of microbiota. Previous studies have shown that in adult middle-sized dogs, the mean oro-cecal transit time lasts ∼14 h, and the mean total intestinal transit time is ∼20–30 h (Hernot et al.2006). Median gastric emptying time of radiolabeled meal was 2.5 h (Van den Brom and Happ 1986), but the total gastric emptying time, defined as all the consumed food has emptied from the stomach, may last up to 20 h (Lidbury et al.2012). It is likely, that because of a gradual increase until median emptying time was reached at 2.5 h, and then subsequent decrease in the concentration of nutrients passing through the small intestine, the makeup of the jejunal microbiota changes gradually in relation to feeding time, as observed in our study.
While feeding led to modifications of microbiota at 60 min, the changes were different when compared to the WF study, suggesting that the collection of samples at 60 min after feeding in the PRE and POST periods, rather than immediately before feeding, did not have an effect on the conclusions of our study that withholding of food over several days has a significant impact on small intestinal microbiota. During the extended period of WF, increases in Proteobacteria and Bacteroidaceae were observed, while members of Firmicutes (e.g. Lactobacillales, Erysipelotrichi) were decreased.
There is only limited data available in regards to the effects of prolonged fasting on the gut microbiota, especially in the small intestine of mammals, a site with important interactions between microbiota and host immune system. Some animal species (e.g. snakes) are well adapted to prolonged periods without food intake, but in general, the results of our study are quite similar to those reported in literature. For example, in Burmese pythons that were not fed for more than 30 days, the microbiota was associated with increased abundances of the genera Bacteroides, Rikenella, Synergistes and Akkermansia in the large intestine, and with reduced overall diversity (Costello et al.2010). Between 12 h and 3 days after feeding, there was a marked increase in Firmicutes (Clostridium, Lactobacillus and Peptostreptococcaceae). Similarly to our findings, the microbiota in the ceca of mice fasted for 24 hs was enriched in Bacteroidetes (Crawford et al.2009). The microbiota in the cecum of Syrian hamsters not fed for 96 h was analyzed by 16S rRNA gene analysis and the mucin-degrading bacterium A. muciniphila and Proteobacteria were increased during active food deprivation, but not during hibernation (Sonoyama et al.2009). A recent study compared microbiota in the colon and cecum across five classes of vertebrae through periods of prolonged food withholding (Kohl et al.2014). Interestingly, different responses in microbial diversity were observed across the animal species. Fish, toads and mice showed increased diversity during food withholding, while quails showed a decrease in diversity. Also, the changes in bacterial taxa varied across the hosts. Similar to our findings, Bacteroidetes increased during fasting in mice and toads, but were unchanged in tilapia, geckos and quails (Kohl et al.2014).
Taken together, these results and findings from previous studies confirm that the lack of nutrients for bacteria shape the intestinal microbiota during prolonged periods of food deprivation. Some bacterial taxa are better adapted to these conditions. For example, Bacteroidetes are capable of utilizing host-derived glycans in the absence of dietary glycans (Sonnenburg et al.2005). Similarly, A. muciniphila has been described as a mucin-degrading bacterium in humans (Derrien et al.2004), and has been observed to increase during food deprivation periods in hamsters (Sonoyama et al.2009) and snakes (Costello et al.2010). The genus Akkermansia was not identified in the current study in the canine jejunum. Furthermore, Akkermansia has only rarely been observed in all our previous studies in dogs, with only a subset of dogs harboring very low proportions of this genus (Minamoto et al.2015). Therefore, the importance of this genus needs further assessment in dogs.
Also, other host derived mechanisms during fasting will affect microbiota composition. For example, increases in luminal pH have been observed in food deprived rats (Ward and Coates 1987). This could be one possible explanation for the decrease in Lactobacillales in this study. This may also be of importance for intestinal health, as microbial derived lactate from Lactobacillus have been shown to be important for maintaining epithelial-cell turnover, which arrests already 12–36 h in starved mice (Okada et al.2013). Also, these changes in gut microbiota may lead to altered metabolism of short-chain fatty acids (SCFA). For example, decreases in total SCFA and acetate were reported in food deprived hamsters (Sonoyama et al.2009). Clearly, further studies looking at functional changes in the gut microbiota are needed to better understand the effects on the small intestinal immune system. As an initial step, we used PICRUSt to predict the metabolic function of the small intestinal gut microbiota. Interestingly, despite obvious phylogenetic changes in the microbiota, only minor functional changes were observed. The only significant difference was an increase in the phosphotransferase system during the food withholding period. The phosphotransferase system pathway is used by bacteria for uptake of sugars when phosphoenolpyruvate is present as an energy source. These sugars can then be used in glycolysis. Increase in the phosphotransferase system would suggest an altered metabolism of bacteria responding to altered sugar content during periods of fasting, and an increase in the phosphotransferase system has also been observed in hepatocytes of food deprived mice (Arion and Nordlie 1965). It is also possible that more changes were missed due to the small sample size and the use of PICRUSt, a predictive system, rather than a full scale DNA shot gun sequencing approach.
The major changes in bacterial groups in the small intestine observed during the extended period of non-feeding are also of clinical interest. For example, an increase in members of Proteobacteria, mostly within Enterobacteriaceae, is commonly observed in the duodenum of dogs with IBD (Xenoulis et al.2008; Suchodolski et al.2010, 2012), and an altered microbiota because of prolonged periods of non-feeding before endoscopy rather than inflammation may cause false interpretation. However, the observed increase in Proteobacteria after 4 days of food withholding was only partly due to Enterobacteriaceae, which increased from a median 0% during PRE to median 0.1% in the food withholding period. Other members of Proteobacteria that increased during food withholding were Succinivibrionaceae and Burkholderiales (Table S2, Supporting Information) and these groups are not typically associated with IBD in the small intestine of dogs (Suchodolski et al.2012). In clinical practice, withholding of food is recommended for 12–24 h before upper GI endoscopy, and for colonoscopy preparation up to 48 h may be recommended. Therefore, little effect on the clinical interpretation of dysbiosis would be expected in this time frame. While studies in mink for example have shown that decreases in mucosal structures as well as brush border enzyme activities are already present at day two of fasting, with no further significant decrease afterwards (Bjornvad, Elnif and Sangild 2004), no information was available about the microbiota of dogs. In dogs that are anorexic for more than 48 h before endoscopy, this prolonged period without food intake may affect some of the bacterial taxa of interest. Therefore, in this study we examined food withdrawal for up to 5 days, to see whether in this additional time period changes in microbiota would be noticeable.
In summary, a prolonged period of food withholding leads to significant changes in the small intestinal microbiota structure, which are reversed after refeeding the same diet within a few days. These changes in bacterial groups may also have significant impact on the metabolic functions of the microbiota. Future studies are also of interest to determine whether prolonged fasting followed by complete change in diet leads to a long-term altered microbiota structure. This could be potentially one way to dramatically alter intestinal microbiota without the use of antibiotics.
SUPPLEMENTARY DATA
FUNDING
ACK was funded by the Texas A&M University, College of Veterinary Medicine & Biomedical Sciences, Veterinary Medical Scientist Research Training Program
Conflict of interest. None declared.
REFERENCES
